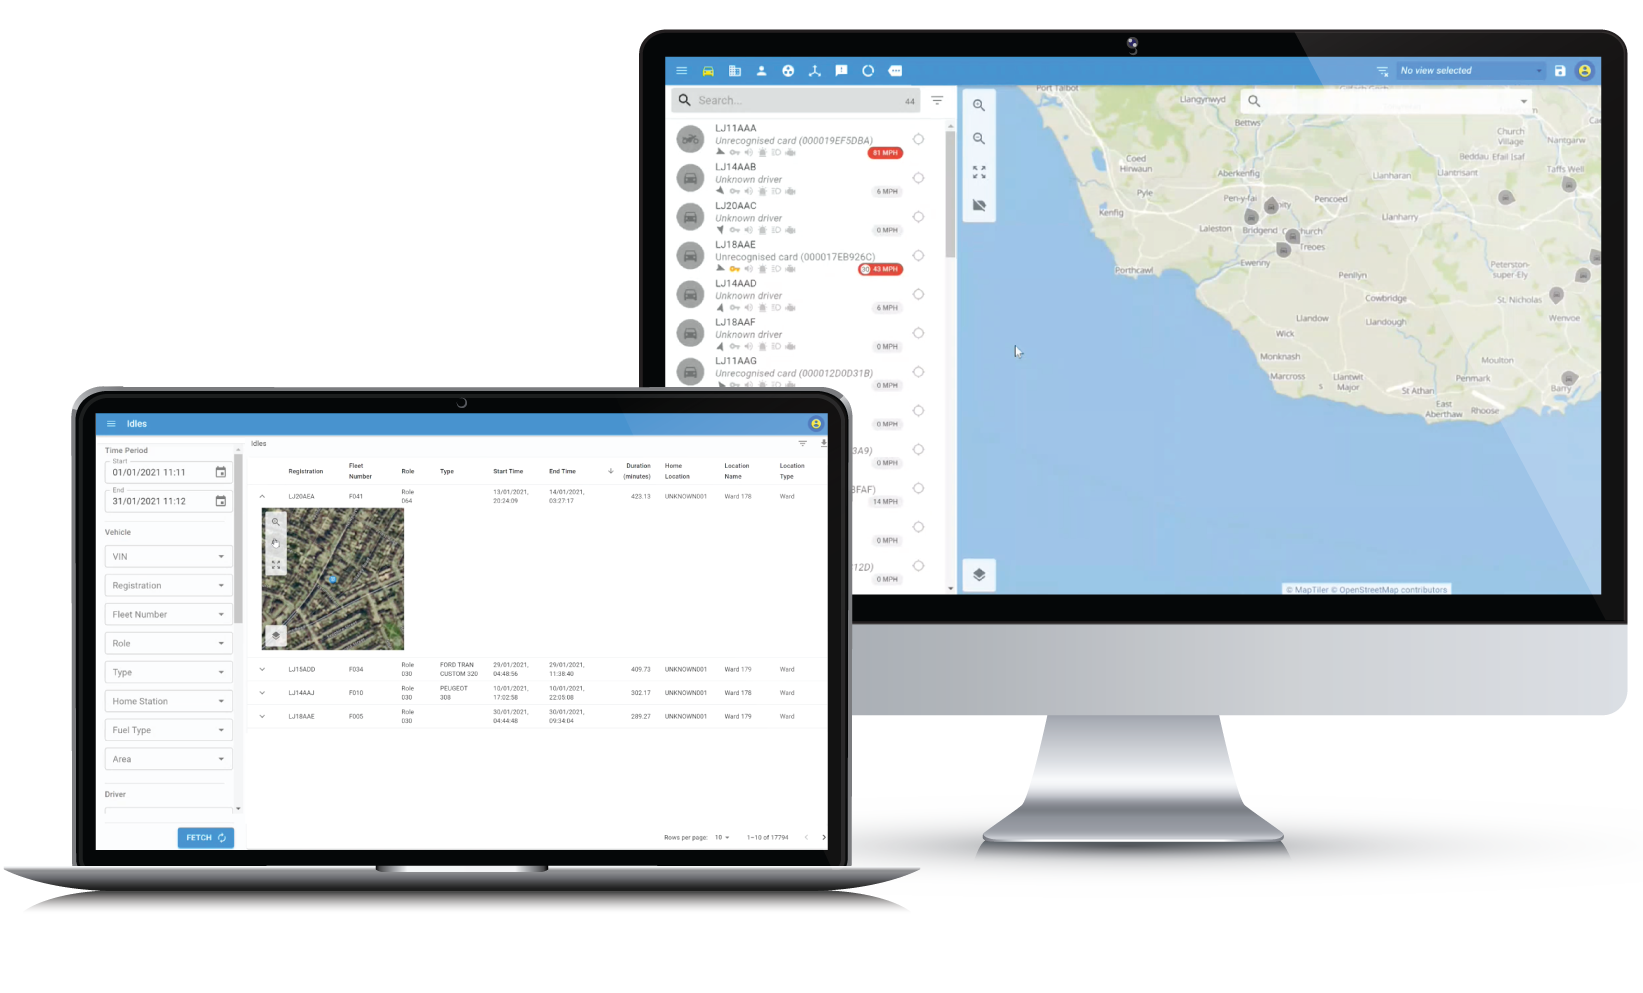
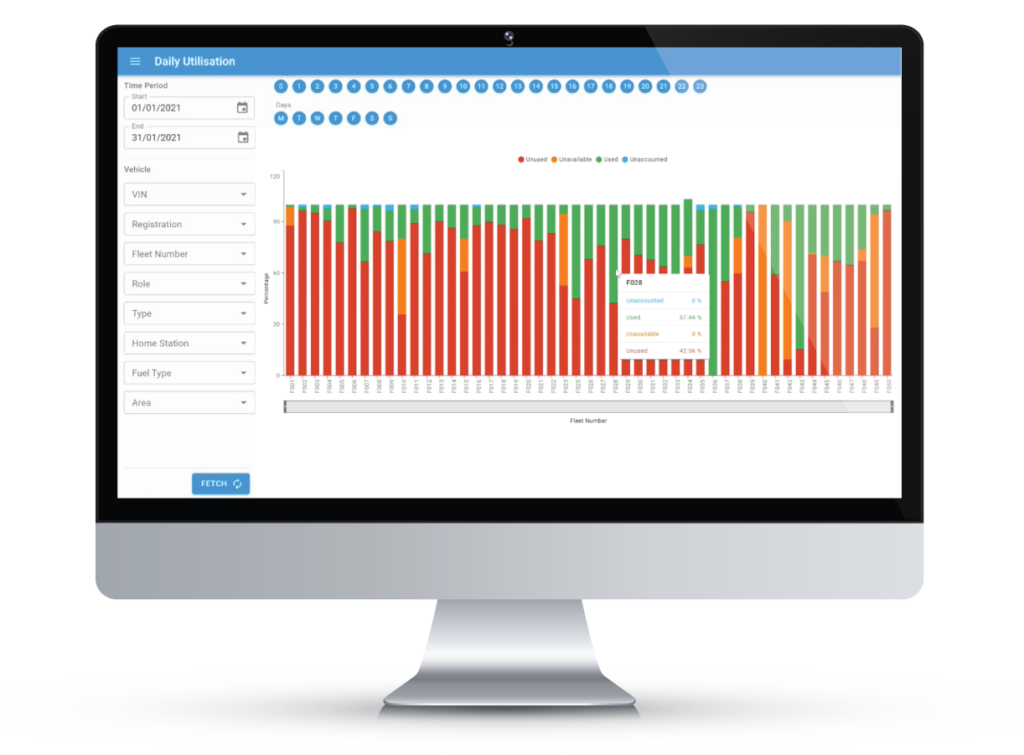
Lightbulb Analytics provides fleet management software that enables users to optimise their fleet operations. Lightbulb achieves this by providing features such as telematics, live tracking, vehicle status, fleet optimisation analysis, vehicle and personnel utilisation, driver behaviour, and collision analysis. It’s a solution built for the police, with police expertise.
Lightbulb Analytics provides fleet management software that enables users to optimise their fleet operations. Lightbulb achieves this by providing features such as telematics, live tracking, vehicle status, fleet optimisation analysis, vehicle and personnel utilisation, driver behaviour, and collision analysis. It’s a solution built for the police, with police expertise.
At our core, we are a software development & data analytics business with over 20 years’ experience in the industry. We strive to provide our clients with “Lightbulb” moments, enabling them to make strategic business decisions based on intelligent data analysis.
Lightbulb Analytics (LBA) are one the UK’s leading providers of telematics driven data analytics. Our analysis is utilised by a number of UK Police Forces and private sector businesses to ensure maximum efficiency and optimal performance of their resources.
But don’t just take our word for it, read about how we’ve helped our clients:
Client experienced an 18% improvement in driver behaviour within 90 days of proactive reporting
On average we reduce overall fleet costs by 20% without compromising operational efficiency
On average we increase resource time in working environments by 22%
We are secure, trustworthy, and
certified.
Lightbulb Analytics has successfully achieved the ISO 27001 Information Security Management Accreditation and the ISO 9001 Quality Management Accreditation. Our clients deserve the best and can continue to benefit from the best practice of the ISO – International Organization for Standardization. And we have the Cyber Essentials Plus accreditation.
Contact Us
Please fill out the below form for more information or to schedule a demo.
We take security seriously and will never share your email address with third parties.